The Term “100-Year Flood” can be Misleading

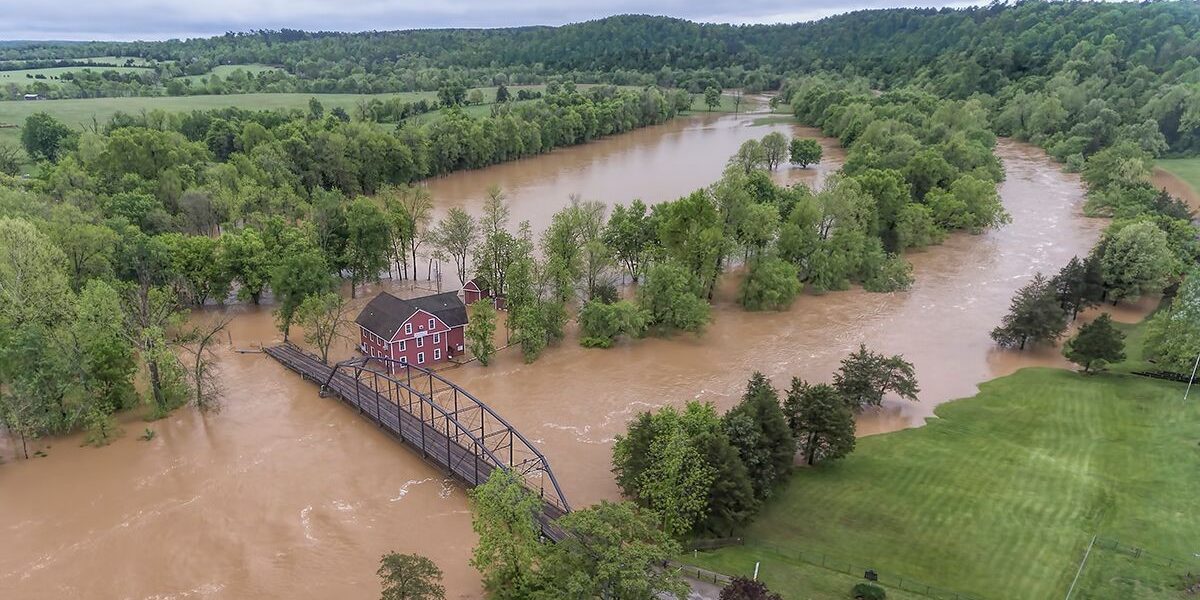
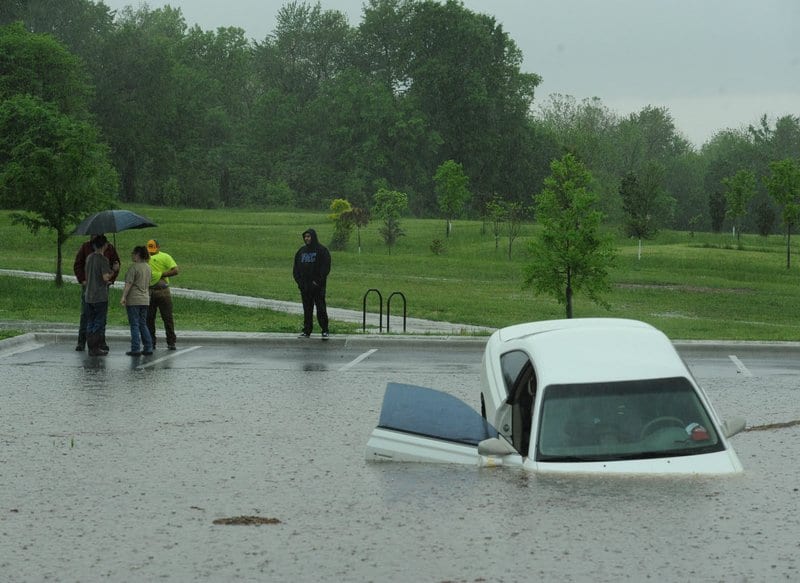
In recent years we’ve seen massive storms that drop several inches or even feet of rain all around the country. In the spring of 2011 the University of Arkansas in Fayetteville actually closed because of rain – and the U of A is on top of a hill! Then there was the record-breaking storm in December of 2015 and another huge storm in April of 2017 in the Illinois River Watershed in northwest Arkansas.
When these floods happen, a lot of people talk about, “whoa, that’s got to be a 100-year flood, maybe even a 500-year flood!” Oftentimes people may be confused because it seems like we might have five 100-year floods in the same number of years. But wait, there should only be one of those every 100 years, right?
Well, not really. The term “100-year flood” can be misleading. In fact, hydrologists don’t like to hear this term being used at all. Instead, hydrologists talk about extreme flood events in terms of a “recurrence interval” or “annual exceedance probability” (AEP).
A so-called 100-year flood has a 100-year recurrence interval, which means that there is a 1 in 100 chance of equaling or exceeding a flood of that size in any given year. Put in other words, the flood has a 1-percent AEP.

The 1-percent AEP is based on statistical chance, which isn’t dependent on what might have happened in previous years. We all know that if we flip a coin once and get a tails, when we flip it again, we still have the same chance of landing on tails – a 50% chance – and it doesn’t matter that we flipped a tails the first time.
Big storms and floods happen irregularly so we could see a lot of big floods over a 10-year period, and hardly any floods the next 10-year period.
Another important factor to keep in mind is that the 1-percent AEP can change with every new flood. This could be because not enough years of data are available or there have been changes in the watershed. The USGS operates 7,500 stream gages around the country; relatively few of them have been in operation for 100 years or more, and many have been in operation less than 30 years. So, every new flood we experience provides more data that can be used to make a better estimate of the 1-percent AEP.
Land use changes can also greatly influence flooding. Think about 3 inches of rain that falls on a forest or a grassland. Most of that water will be caught by trees and plants or be soaked up by the soil. But, think about what you see when 3 inches of rain falls on a street or other hard surfaces. That water doesn’t soak into the ground, but runs off the land into the nearby river. So as more land is developed, the same amount of rain can cause bigger floods.
“Since the 1-percent AEP is statistically calculated using data available at that time, as more data is generated, the 1-percent AEP will change. The 1-percent AEP might also change if a watershed goes through changes in land use, or with climate change,” explains Dan Wagner, hydrologist with the US Geological Survey in Fayetteville.
Dan Wagner estimated the AEPs for the USGS gaging station on the White River at Wyman Road in east Fayetteville, which has 54 years of flow data. The 100-year recurrence interval, or 1-percent AEP, for flow is 115,000 cubic feet per second (cfs). That is to say, there is a 1 in 100 chance of 115,000 cfs being equaled or exceeded any given year.
Let’s put that into context with the floods of 2011, 2015, and 2017 mentioned previously. It turns out that those three floods had a recurrence interval of only about 2 to 10 years, or a 50- to 10-percent AEP.

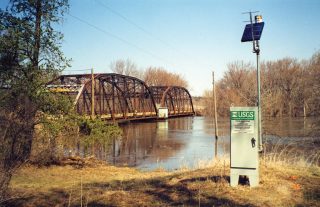
US Geological Survey gaging station.
Peak flows for those three floods were:
- 52,900 cfs on April 25, 2011
- 54,000 cfs on December 27, 2015
- 29,400 cfs on April 26, 2017
It seems hard to imagine then, what a “100-year flood”, or 115,000 cfs, actually looks like on the White River at Wyman Road.
It is important to mention the large amount of variability in estimating or measuring flow and AEPs. For example, the 1-percent AEP is 115,000 cfs. But, that’s not giving the whole story. Statistical analyses always come with some amount of uncertainty in the result. So the 1-percent AEP is 115,000 cfs, but could actually be anywhere between 81,100 and 163,000 cfs, based on the 95 percent confidence interval. A confidence interval is a measure of statistical certainty.
The more years of flow data for a particular site, the lower the amount of uncertainty. The gaging station on the White River at Wyman Road has been collecting data for 54 years. Some gaging stations around the country have been collecting data for over 100 years, and those sites will have less uncertainty in their AEP estimations. Also, assuming no significant changes in the watershed, statistical predictions indicate that hydrologists may need as much as 2,000 years of flow data at a site in order for the estimation of a 1-percent AEP to stabilize, or to not change with more years of data.
You can see the recent report from the USGS where Dan Wagner and colleagues estimated various AEPs for many of the USGS gaging stations in Arkansas, and developed equations to predict flows corresponding to various AEPs at ungaged locations on streams around the State.


